Info Table
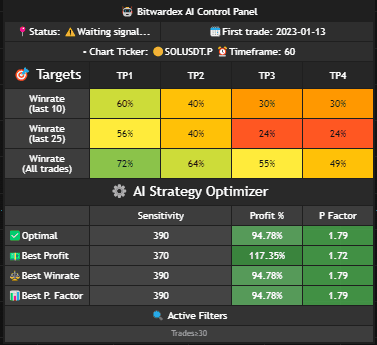
Informative table with analytics and current market conditions
General Information
Status
Current indicator status. Shows the system state:
- ⚠️ Waiting signal... — indicator is active and waiting for a trading signal
- 🟢 LONG — indicator is active and in a LONG position
- 🔴 SHORT — indicator is active and in a SHORT position
First Trade
Date of the strategy's first trade. Helps track the indicator's operating history.
Chart Ticker
Current trading instrument on which the indicator is operating (e.g., SOLUSDT.P).
Timeframe
Chart timeframe on which analysis is performed (e.g., 60 minutes).
Targets
The table shows winrate (percentage of profitable trades) for different Take Profit (TP) levels based on various analysis periods.
Table Structure
The table contains three rows with winrate data:
- Winrate (last 10) — winrate for the last 10 trades
- Winrate (last 25) — winrate for the last 25 trades
- Winrate (All trades) — overall winrate for all trades
Columns TP1, TP2, TP3, TP4
Each column shows winrate for the corresponding Take Profit level:
- TP1 — first profit-taking level
- TP2 — second profit-taking level
- TP3 — third profit-taking level
- TP4 — fourth profit-taking level
Color Indication
Winrates are displayed with color indication for quick assessment:
- Green — high winrate (good performance)
- Yellow/Orange — medium winrate (moderate performance)
- Red — low winrate (low performance)
Tip: Pay attention to winrate for "All trades" — it shows the overall strategy efficiency. High winrate values for TP1 and TP2 indicate stable performance.
AI Strategy Optimizer
The table shows various optimized strategy configurations based on the indicator's automatic calculations.
Optimization Types
- ✅ Optimal — balanced option that considers all factors to achieve the best overall result. Recommended for most cases.
- 📈 Best Profit — configuration optimized for maximum profit percentage. Suitable if your goal is to maximize returns.
- ⚖️ Best Winrate — configuration optimized for the highest percentage of profitable trades. Useful if you want to minimize the number of losing trades.
- 📊 Best P. Factor — configuration optimized for the highest profit factor (gross profit to gross loss ratio). A high profit factor indicates strategy efficiency.
Optimization Parameters
For each optimization type, the following are displayed:
- Sensitivity — sensitivity value corresponding to this optimization. Use this value in the Signal Settings section.
- Profit % — profit achieved in percentage for this configuration.
- P Factor — profit factor (gross profit to gross loss ratio). Values above 1.0 indicate strategy profitability.
Tip: Based on profit (Profit %) and profit factor (P Factor) metrics, select the sensitivity that best suits you. Usually, using the value from the "Optimal" row is recommended for a balanced approach.
Active Filters
The bottom of the table shows active filters that are applied to the optimizer data. Filter management is located in AI Optimizer Filters
Filter Example
- Trades > 30 — shows only strategies or data that have more than 30 trades. This helps filter out unstable or insufficiently tested configurations.
Usage
Info Table helps:
- Track strategy performance through winrates for different TP levels
- Determine optimal sensitivity settings through AI Strategy Optimizer
- Analyze current market conditions through general information
- Make informed decisions based on optimization data
Tip: Use data from AI Strategy Optimizer to select optimal sensitivity. Go to the Signal Settings section and set the Sensitivity value from the selected optimizer row. More about this in the Recommendations section.