Recommendations
Step-by-step optimization algorithm to achieve the best results
Bitwardex AI Algo is an intelligent indicator with deep auto-optimization and auto-adaptation features, making the setup process simple and fast. Our algorithms automatically adjust Take Profit (TP) levels to market volatility and increase position size when consolidation is detected to compensate for low market activity. The core of the strategy is based on proprietary methods and developments, making the product truly unique in its kind.
The main default parameters are already optimized through internal calculations, but to achieve the best results, we recommend performing a small manual adjustment. In this section, we share a step-by-step optimization algorithm that will help you achieve stable profits with minimal drawdowns.
Step-by-Step Optimization Algorithm
Follow these steps to quickly and efficiently configure Bitwardex AI Algo for your market and trading style. We focus on stable profitability, avoiding sharp spikes and minimizing drawdowns, which can be tracked in the TradingView Strategy Tester.
Step 1: Set Sensitivity from Info Table
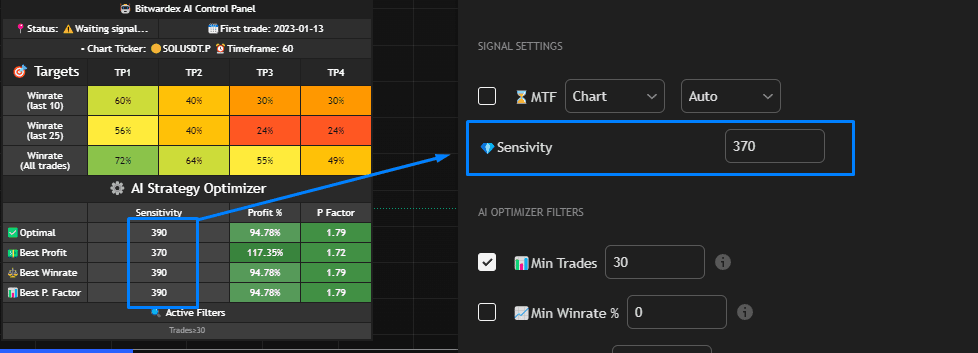
After adding the indicator to your chart, enable Info Table if the table is hidden in the settings. The indicator automatically optimizes all possible sensitivity values based on multiple calculations and provides you with a brief summary of results in the AI Strategy Optimizer table.
The following types of optimized sensitivity are available in the table:
- Optimal — balanced option that considers all factors to achieve the best overall result. Recommended for most cases.
- Best Profit — value optimized for maximum profit percentage. Suitable if your goal is to maximize returns.
- Best Winrate — value optimized for the highest percentage of profitable trades. Useful if you want to minimize the number of losing trades.
- Best P. Factor — value optimized for the highest profit factor (gross profit to gross loss ratio). A high profit factor indicates strategy efficiency.
Based on profit (Profit %) and profit factor (P Factor) metrics, select the sensitivity that best suits you. Go to the Signal Settings section and set this value in the Sensitivity field (see screenshot).
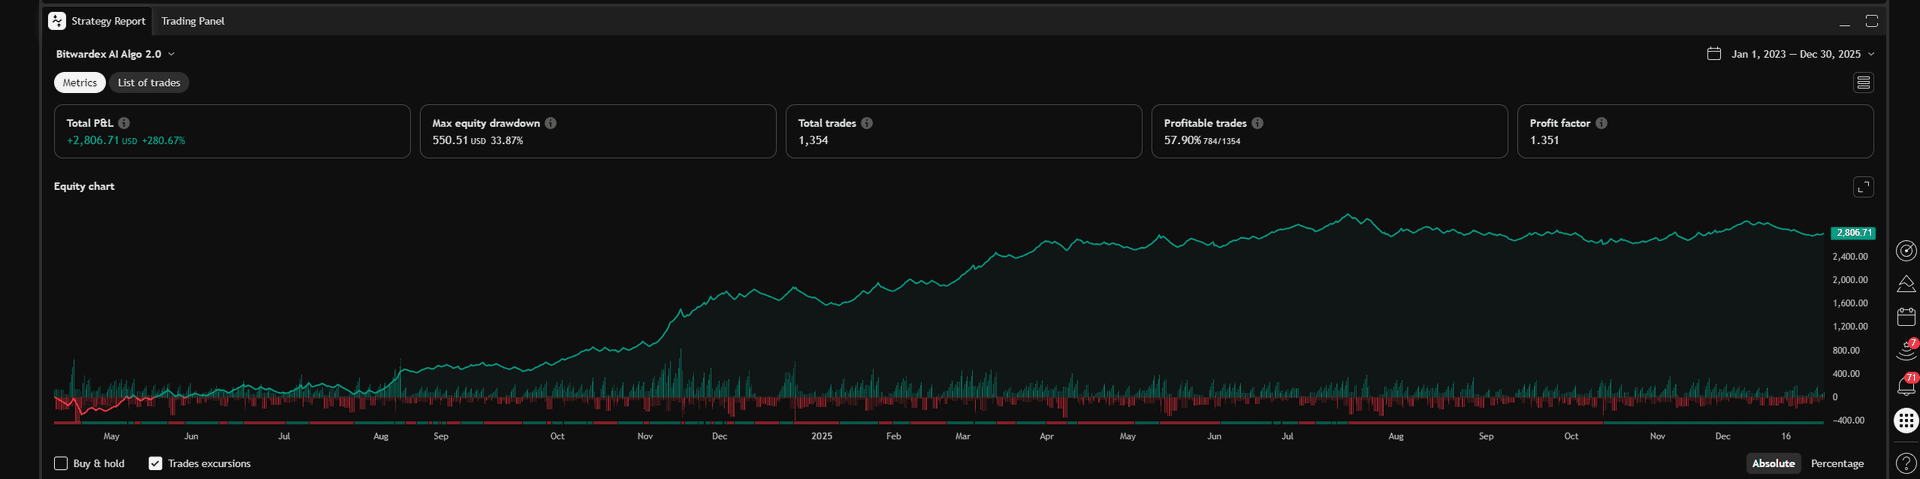
Step 2: Check Backtest Results
Run a backtest in the TradingView Strategy Tester and evaluate the profit curve. Pay attention to:
- Profit stability: The curve should grow smoothly, without sharp spikes.
- Drawdowns: Make sure drawdowns are minimal and acceptable within your risk management framework.
- If the results satisfy you, you can start trading with these settings. If not, proceed to the next step or choose a different asset.
Step 3: Configure Timeframes for Trend Filter and Signal Settings
If the backtest showed unstable profits or large drawdowns, start by using auto modes for multi-timeframe analysis:
- In the Trend Filter section, enable Check box Trend Timeframe and set Trend Timeframe Mode to Auto. The strategy will automatically select the optimal timeframe above the current chart for trend analysis.
- In the Signal Settings section, enable Check box Multi-Timeframe and set Multi-Timeframe Mode to Auto. The strategy will automatically select the optimal timeframe for signal generation.
- After enabling auto modes, return to Info Table and check if Best Sensitivity has changed. If the value has been updated, set the new sensitivity in Signal Settings and run the backtest again.
If auto modes did not produce the desired result (unstable profits or large drawdowns persist), switch to manual configuration:
- In the Trend Filter section, switch Trend Timeframe Mode to Manual and try different timeframes (e.g., 1H, 4H, 1D) to find the optimal one for your market.
- In the Signal Settings section, switch Multi-Timeframe Mode to Manual and try different timeframes (e.g., 15M, 30M, 1H).
- After each change, return to Info Table and check if Best Sensitivity has changed. If the value has been updated, set the new sensitivity in Signal Settings and run the backtest again. Repeat this process until the profit curve becomes stable and drawdowns are minimal.
Tip: Start with auto modes — they often provide optimal results without manual configuration. If auto modes show poor results, switch to manual configuration and experiment with timeframes so the strategy can optimize itself most effectively. For volatile markets (e.g., cryptocurrencies), in manual mode try higher timeframes (4H, 1D) for Trend Filter to filter out false signals.
Step 4: Manual Parameter Adjustment (if necessary)
If changing timeframes did not produce the desired result, try manually adjusting the following parameters:
- Sensitivity and Period in Trend Filter: Increase or decrease Sensitivity (e.g., from 20 to 25) and Period (e.g., from 5 to 10) in the Trend Filter section to make the trend filter stricter or more lenient. Check the backtest after each change.
- Take Profit and Stop Loss: In the Take Profit and Stop Loss section, try changing TP and SL values (e.g., increase TP1 from 2% to 3% or decrease SL from 3% to 2%). You can switch the calculation mode from % to ATR so levels automatically adapt to volatility.
- Trailing Stop and Breakeven: Enable Trailing Stop and Breakeven to reduce losses. For example, set Activate Percent for Trailing Stop to 1%, and Breakeven Value to TP1 to quickly secure breakeven.
Tip: If the market shows high volatility (see Market Volatility in Info Table), use ATR mode for TP/SL to capture large price movements.
Step 5: Use Additional Features to Improve Efficiency
Once you have found optimal parameters, you can improve backtest results by using the following features:
- Consolidation Risk Control: Enable this feature in the Consolidation Risk Control section to automatically increase position size by 1.5x during flat markets. This helps compensate for low volatility.
- Martingale: In the Risk Management section, enable Check box Martingale and set a small Martingale Multiplier (e.g., 1.5). This can increase profitability, but be careful — martingale increases risks.
- Dynamic Exits: Enable Dynamic Exits in the Take Profit and Stop Loss section to automatically close positions at overbought/oversold levels (RSI ≥ 70 for Long, RSI ≤ 30 for Short).
⚠️ Warning: Use Martingale only with a small deposit and limit the maximum position size through Maximum Order Size of a Position.
Additional Tips
- Testing on Historical Data: Use Date Limit Settings to test the strategy on different periods. Also, use the Deep Backtest function to test the strategy over the long term.
- Stability is more important than high profit: High profit with large drawdowns is less sustainable than stable growth with minimal risks.